Data
You will be redirected to cenamweb.org in 15 second(s). The JINA-CEE website is not updated anymore. The archived website can still be reached through the CeNAM website.
Supernova light curves and spectra: Results from a novel modeling pipeline
Core-collapse supernovae are the explosive death of massive stars. The explosion that follows the gravitational collapse of these stars, is an energetic event which we can observe with telescopes. These supernovae are also an important site for the synthesis of a range of chemical elements and they play an important role in the evolution of galaxies.
The numerical modeling of core-collapse supernovae is challenging. On the one hand, the full problem in 3D is an exascale problem, allowing for only a handful of simulations of short duration (0.5-1 sec after the explosion) - not nearly enough to predict observables such as nucleosynthesis, light curves, and spectra. On the other hand, the computationally cheaper simulations assuming spherical symmetry do not explode self-consistently, leaving researchers with a dilemma how to tackle open questions that require many exploding, long-term simulations. To fill this gap, JINA-CEE researcher Carla Frohlich (NCSU) and her collaborators have developed an effective core-collapse supernova model called "PUSH" [1,2,3,4], which allows for consistent predictions of all observables within the model. The PUSH model mimics in spherical symmetry the increased net neutrino-heating seen in multi-dimensional simulations, via an additional heating term which is coupled to the heavy neutrinos.
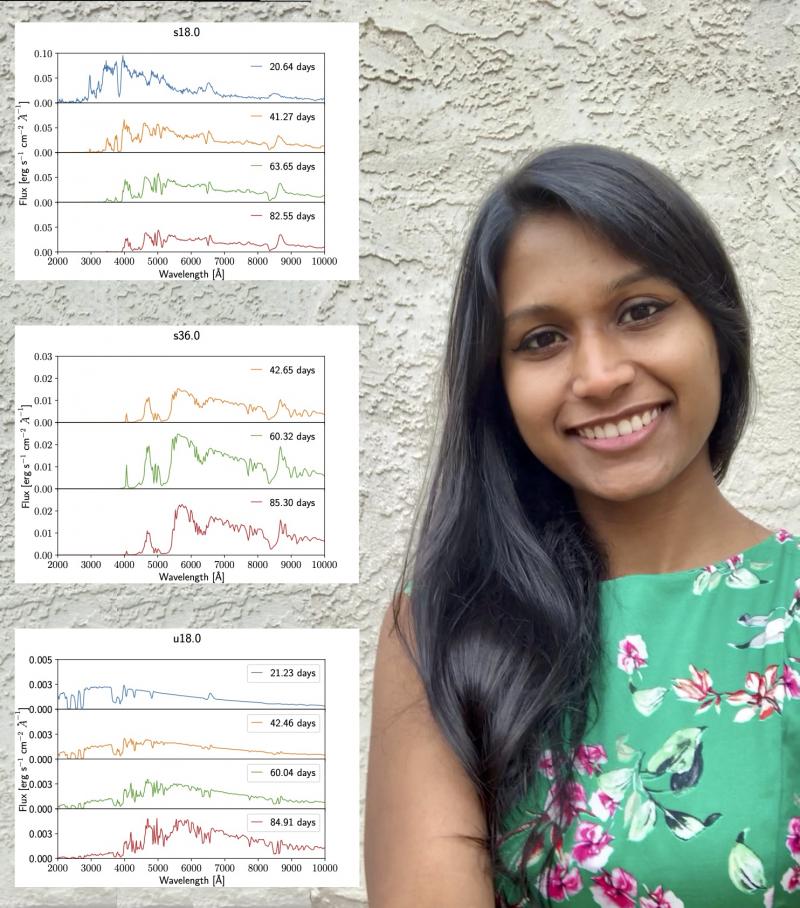
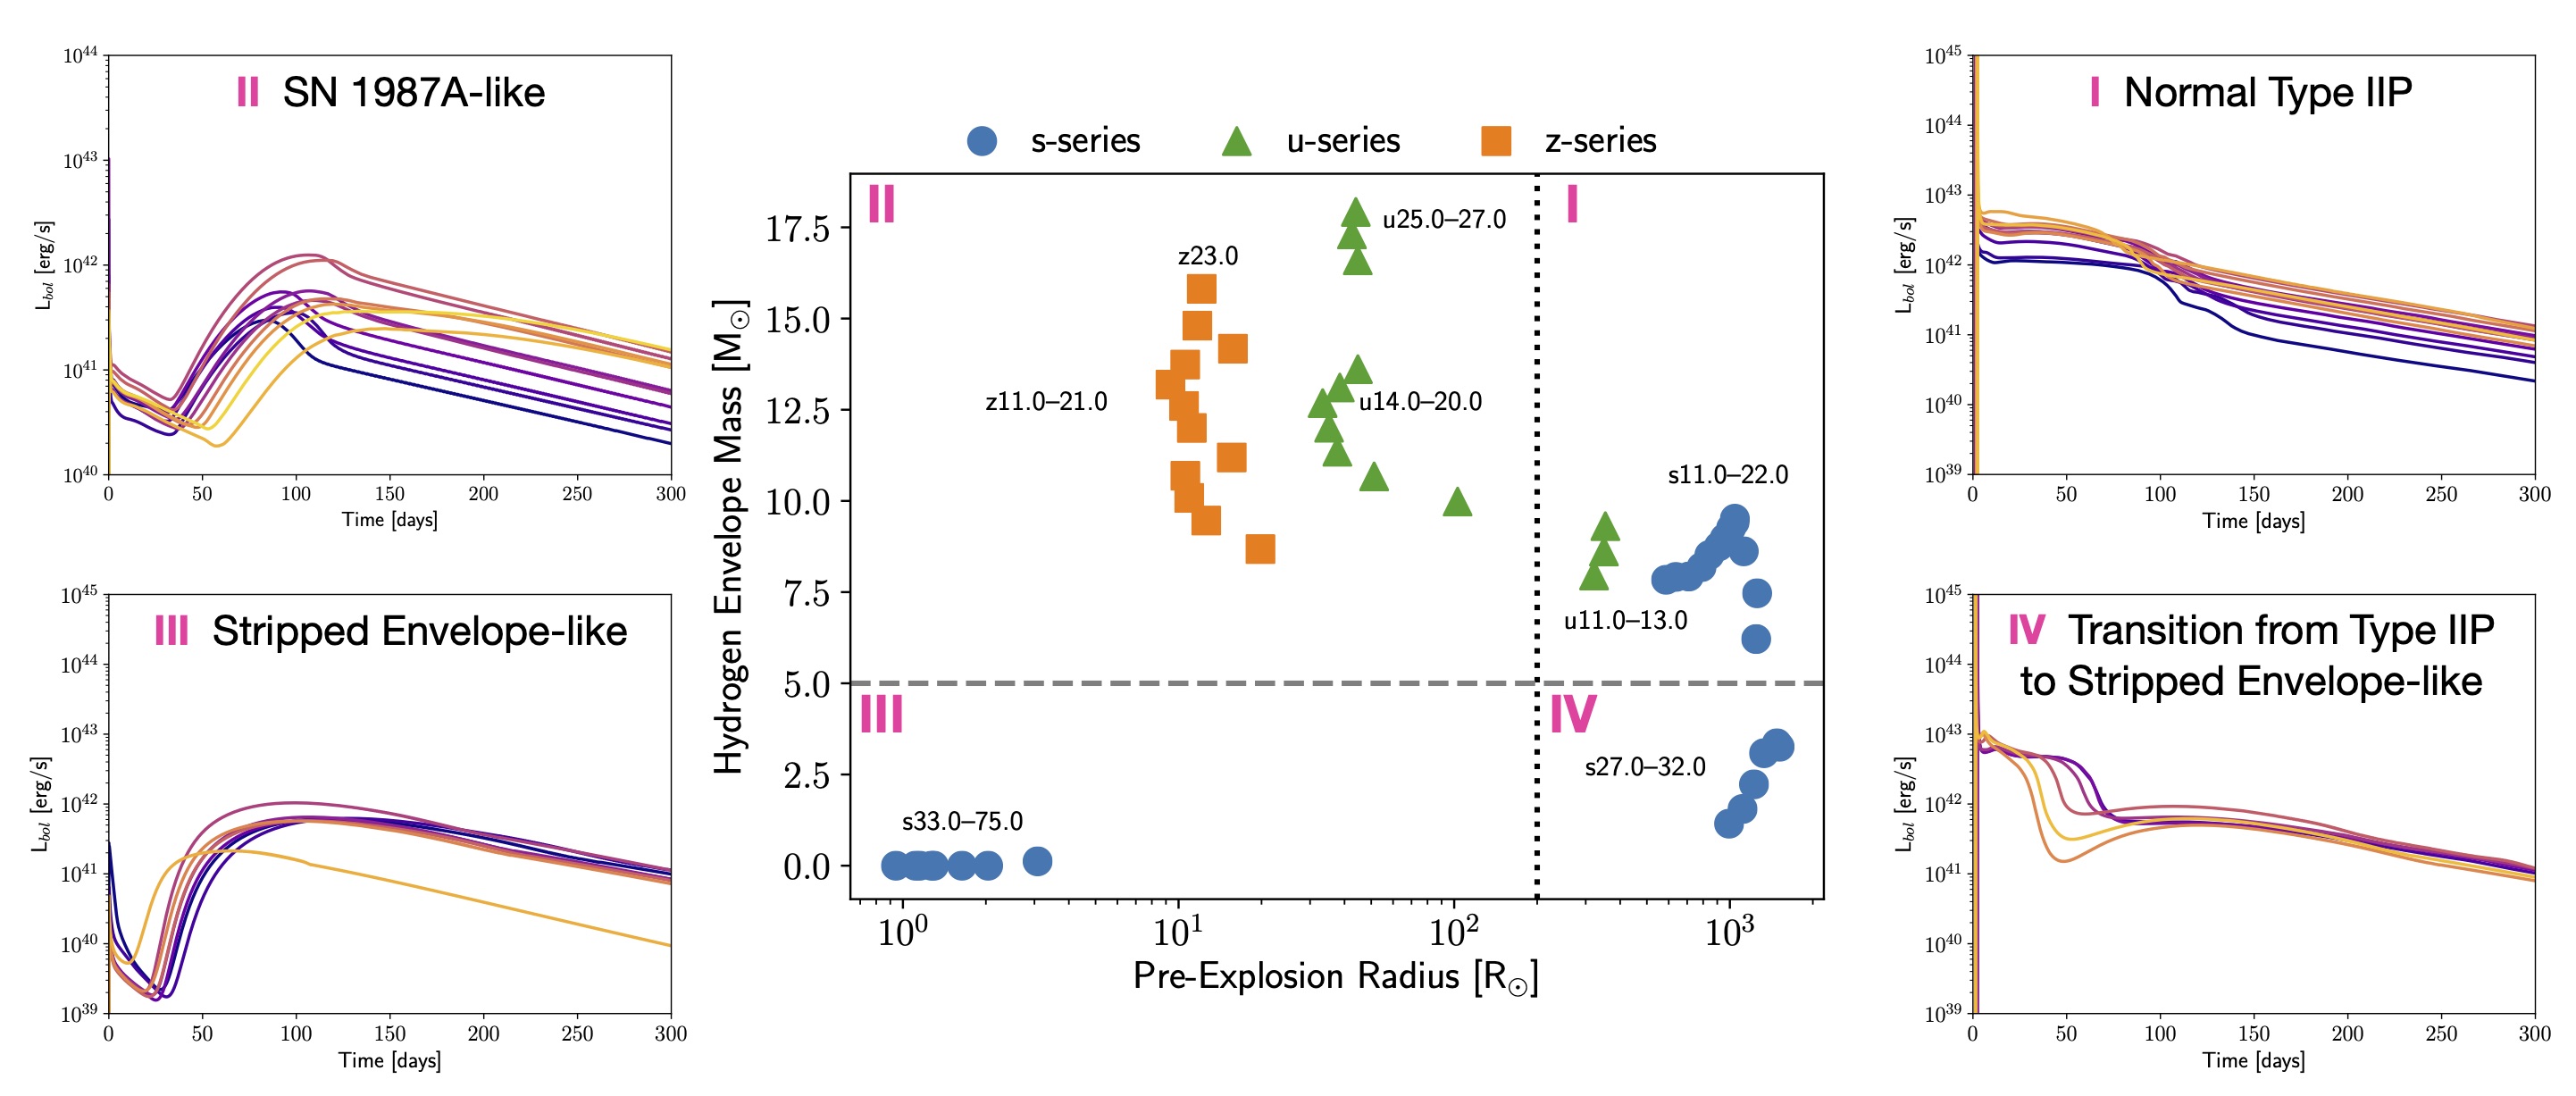
Recently, PhD candidate Sanjana Curtis (NCSU/LANL) with undergraduate student Noah Wolfe (NCSU) and collaborators have developed a novel pipeline to take core-collapse supernova models from PUSH to bolometric light curves, broadband light curves, and spectra. Processing 64 models at three different metallicities and a wide range of initial masses with this pipeline has revealed interesting trends and categories. For example, the bolometric light curves fall into four categories that are characterized by the stellar radius at collapse and the mass of the hydrogen envelope at collapse (Fig 2). The sample of models is large enough to perform a quantitative sensitive-variable analysis for the first time. The spectra cover the time from photospheric to nebular phase, and show characteristic line blanketing. With this work, a large sample of theoretical predictions for core-collapse supernova observables is available for the first time without any hand-tuning beyond the initial calibration of the PUSH method. This opens an exciting perspective for analysis of collective observables from core-collapse supernova models that can be directly compared to observations.
References:
[1] Perego et al Astrophysical Journal 806,275 (2015)
[2] Ebinger et al Astrophysical Journal 870,1 (2019)
[3] Curtis et al Astrophysical Journal 870, 2 (2019)
[4] Ebinger et al Astrophysical Journal 888,91 (2020)